These days, you can personalize everything. There’s no one-size-fits-all approach. But, for business, this is actually a great thing. It creates a lot of space for healthy competition and opportunities for companies to get creative about how they acquire and retain customers.
One of the fundamental steps towards better personalization is customer segmentation. This is where personalization starts, and proper segmentation will help you make decisions regarding new features, new products, pricing, marketing strategies, even things like in-app recommendations.
But, doing segmentation manually can be exhausting. Why not employ machine learning to do it for us? In this article, I’ll tell you how to do just that.
Customer segmentation simply means grouping your customers according to various characteristics (for example grouping customers by age).
It’s a way for organizations to understand their customers. Knowing the differences between customer groups, it’s easier to make strategic decisions regarding product growth and marketing.
The opportunities to segment are endless and depend mainly on how much customer data you have at your use. Starting from the basic criteria, like gender, hobby, or age, it goes all the way to things like “time spent of website X” or “time since user opened our app”.
There are different methodologies for customer segmentation, and they depend on four types of parameters:
Geographic customer segmentation is very simple, it’s all about the user’s location. This can be implemented in various ways. You can group by country, state, city, or zip code.
Demographic segmentation is related to the structure, size, and movements of customers over space and time. Many companies use gender differences to create and market products. Parental status is another important feature. You can obtain data like this from customer surveys.
Behavioral customer segmentation is based on past observed behaviors of customers that can be used to predict future actions. For example, brands that customers purchase, or moments when they buy the most. The behavioral aspect of customer segmentation not only tries to understand reasons for purchase but also how those reasons change throughout the year.
Psychological segmentation of customers generally deals with things like personality traits, attitudes, or beliefs. This data is obtained using customer surveys, and it can be used to gauge customer sentiment.
Implementing customer segmentation leads to plenty of new business opportunities. You can do a lot of optimization in:
Let’s discuss these benefits in more depth.
Nobody likes to invest in campaigns that don’t generate any new customers. Most companies don’t have huge marketing budgets, so that money has to be spent right. Segmentation enables you to target customers with the highest potential value first, so you get the most out of your marketing budget.
Customer segmentation helps you understand what your users need. You can identify the most active users/customers, and optimize your application/offer towards their needs.
Properly implemented customer segmentation helps you plan special offers and deals. Frequent deals have become a staple of e-commerce and commercial software in the past few years. If you reach a customer with just the right offer, at the right time, there’s a huge chance they’re going to buy. Customer segmentation will help you tailor your special offers perfectly.
The marketing strategy can be directly improved with segmentation because you can plan personalized marketing campaigns for different customer segments, using the channels that they use the most.
By studying different customer groups, you learn what they value the most about your company. This information will help you create personalized products and services that perfectly fit your customers’ preferences.
In the next section, we’re going to discuss why machine learning for customer segmentation.
Machine learning methodologies are a great tool for analyzing customer data and finding insights and patterns. Artificially intelligent models are powerful tools for decision-makers. They can precisely identify customer segments, which is much harder to do manually or with conventional analytical methods.
There are many machine learning algorithms, each suitable for a specific type of problem. One very common machine learning algorithm that’s suitable for customer segmentation problems is the k-means clustering algorithm. There are other clustering algorithms as well such as DBSCAN, Agglomerative Clustering, and BIRCH, etc.
Why would you implement machine learning for customer segmentation?
Manual customer segmentation is time-consuming. It takes months, even years to analyze piles of data and find patterns manually. Also if done heuristically, it may not have the accuracy to be useful as expected.
Customer segmentation used to be done manually and wasn’t too precise. You’d manually create and populating different data tables, and analyze the data like a detective with a looking glass. Now, it’s much better (and relatively easy thanks to rapid progress in ML) to just use machine learning, which can free up your time to focus on more demanding problems that require creativity to solve.
Customer Segmentation is not a “develop once and use forever” type of project. Data is ever-changing, trends oscillate, everything keeps changing after your model is deployed. Usually, more labeled data becomes available after development, and it’s a great resource for improving the overall performance of your model.
There are many ways to update customer segmentation models, but here are the two main approaches:
Machine learning models deployed in production support scalability, thanks to cloud infrastructure. These models are quite flexible for future changes and feedback. For example, consider a company that has 10000 customers today, and they’ve implemented a customer segmentation model. After a year, if the company has 1 million customers, then ideally we don’t need to create a separate project to handle this increased data. Machine Learning models have the inherent capability to handle more data and scale in production.
The value of an optimal number of clusters for given customer data is easy to find using machine learning methods like the elbow method. Not only the optimal number of clusters but also the performance of the model is far better when we use machine learning.
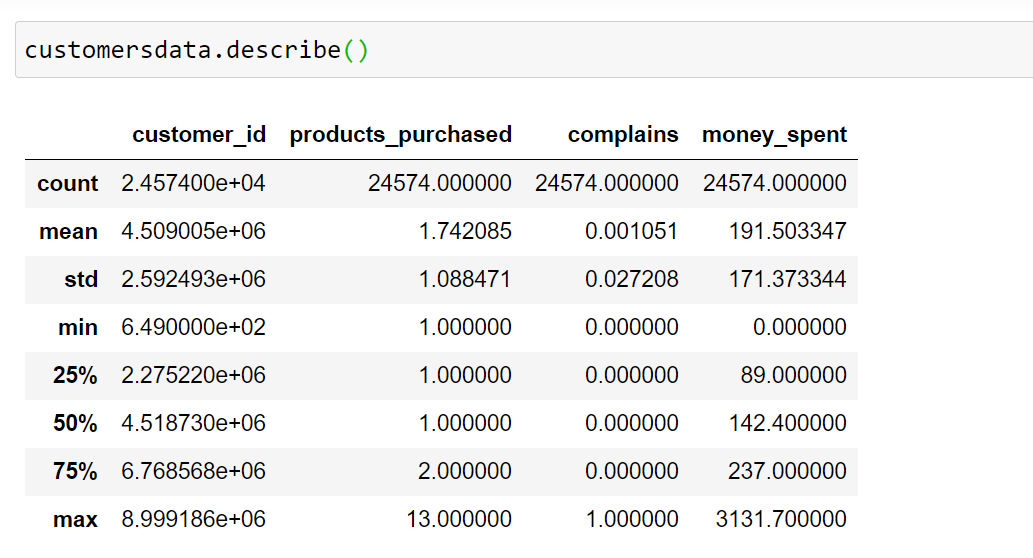
Let’s analyze a customer dataset. Our dataset has 24,000 data points and four features. The features are:

In the upcoming section, we’ll pre-process this dataset.
Before feeding the data to the k-means clustering algorithm, we need to pre-process the dataset. Let’s implement the necessary pre-processing for the customer dataset.

Moving on, we’ll implement our k-means clustering algorithm in Python.
K-Means clustering is an efficient machine learning algorithm to solve data clustering problems. It’s an unsupervised algorithm that’s quite suitable for solving customer segmentation problems. Before we move on, let’s quickly explore two key concepts
Unsupervised machine learning is quite different from supervised machine learning. It’s a special kind of machine learning algorithm that discovers patterns in the dataset from unlabelled data.
Unsupervised machine learning algorithms can group data points based on similar attributes in the dataset. One of the main types of unsupervised models is clustering models.
Note that, supervised learning helps us produce an output from the previous experience.
A clustering machine learning algorithm is an unsupervised machine learning algorithm. It’s used for discovering natural groupings or patterns in the dataset. It’s worth noting that clustering algorithms just interpret the input data and find natural clusters in it.
Some of the most popular clustering algorithms are:
In the following section, we’re going to analyze the customer segmentation problem using the k-means clustering algorithm and machine learning. However, before that, let’s quickly discuss why we’re using the k-means clustering algorithm.
Unlike supervised learning algorithms, K-means clustering is an unsupervised machine learning algorithm. This algorithm is used when we have unlabelled data. Unlabelled data means input data without categories or groups provided. Our customer segmentation data is like this for this problem.
The algorithm discovers groups (cluster) in the data, where the number of clusters is represented by the K value. The algorithm acts iteratively to assign each input data to one of K clusters, as per the features provided. All of this makes k-means quite suitable for the customer segmentation problem.
Given a set of data points are grouped as per feature similarity. The output of the K-means clustering algorithm is:
At the end of implementation, we’re going to get output such as a group of clusters along with which customer belongs to which cluster.
First, we need to implement the required Python libraries as shown in the table below.
# Import required libraries import pandas as pd import numpy as np from sklearn.cluster import KMeans import plotly.express as px import plotly.graph_objects as go import matplotlib.pyplot as plt
We’ve imported the pandas, NumPy sklearn, plotly and matplotlib libraries. Pandas and NumPy are used for data wrangling and manipulation, sklearn is used for modelling, and plotly along with matplotlib will be used to plot graphs and images.
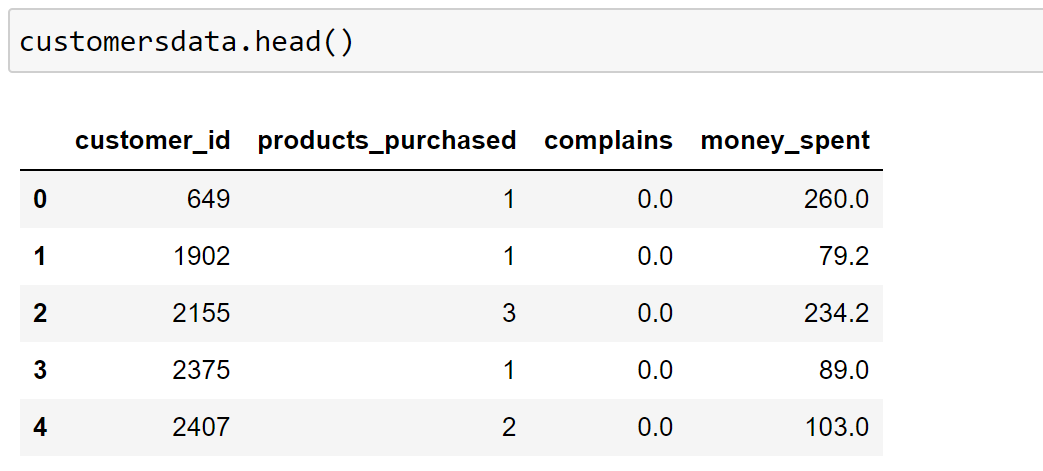
After importing the library, our next step is to load the data in the pandas data frame. For this, we’re going to use the read_csv method of pandas.
#Load customers data customersdata = pd.read_csv("customers-data.csv")
After loading the data, we need to define the K- means model. This is done with the help of the KMeans class that we imported from sklearn, as shown in the code below.
# Define K-means model kmeans_model = KMeans(init='k-means++', max_iter=400, random_state=42)
After defining the model, we want to train is using a training dataset. This is implemented with the use of the fit method, as shown in the code below.
# Train the model kmeans_model.fit(customersdata[['products_purchased','complains', 'money_spent']])
Note that we’re passing three features to the fit method, namely products_purchased, complains, and money_spent.
Though we have trained a K-means model up to these points, we haven’t found the optimal number of clusters required in this case of customer segmentation. Finding the optimal number of clusters, for the given dataset is important for producing a high-performant k-means clustering model.
In the upcoming section, we’re going to find the optimal number of clusters of the given dataset and then re-train the k-means clustering model with these optimal values of k. This will produce our final model.
Finding the optimal number of clusters is one of the key tasks when implementing a k-means clustering algorithm. It’s worth noting that a k-means clustering model might converge for any value of K, but at the same time, not all values of K will produce the best model.
For some datasets, data visualization can help understand the optimal number of clusters, but this doesn’t apply to all datasets. We have a few methods, such as the elbow method, gap statistic method, and average silhouette method, to assess the optimal number of clusters for a given dataset. We’ll discuss them one by one.
We’re going to use the elbow method. The K-means clustering algorithm clusters data by separating given data points in k groups of equal variances. This effectively minimizes a parameter named inertia. Inertia is nothing but within-cluster sum-of-squares distances in this case.
When we use the elbow method, we gradually increase the number of clusters from 2 until we reach the number of clusters where adding more clusters won’t cause a significant drop in the values of inertia.
The stage at this number of clusters is called the elbow of the clustering model. We’ll see that in our case it’s K =5.
For implementing the elbow method, the below function named “try_different_clusters” is created first. It takes two values as input:
# Create the K means model for different values of K def try_different_clusters(K, data): cluster_values = list(range(1, K+1)) inertias=[] for c in cluster_values: model = KMeans(n_clusters = c,init='k-means++',max_iter=400,random_state=42) model.fit(data) inertias.append(model.inertia_) return inertias
The method try_different_clusters is called using the below code, where we pass the values of K from 1 to 12 and calculate the inertia for each value of k.
# Find output for k values between 1 to 12 outputs = try_different_clusters(12, customersdata[['products_purchased','complains','money_spent']]) distances = pd.DataFrame("clusters": list(range(1, 13)),"sum of squared distances": outputs>)
Using the below code, we plot the value of K (on the x-axis) against corresponding values of inertia on the Y-axis.
# Finding optimal number of clusters k figure = go.Figure() figure.add_trace(go.Scatter(x=distances["clusters"], y=distances["sum of squared distances"])) figure.update_layout(xaxis = dict(tick0 = 1,dtick = 1,tickmode = 'linear'), xaxis_title="Number of clusters", yaxis_title="Sum of squared distances", title_text="Finding optimal number of clusters using elbow method") figure.show()
We can generate the below plot using the above code. The elbow of the code is at K=5. We have chosen 5 as if we increase the number of clusters to more than 5, there is very small change in the inertia or sum of the squared distance.

Optimal value of K = 5
The stage at which the number of clusters is optimal is called the elbow of the clustering model. For example, in the below image, the elbow is at five clusters (K =5). Adding more than 5 clusters will cause the creation of an inefficient or less performant clustering model.
As discussed before, we need to train the k-means clustering model again with the optimal number of clusters found.
# Re-Train K means model with k=5 kmeans_model_new = KMeans(n_clusters = 5,init='k-means++',max_iter=400,random_state=42) kmeans_model_new.fit_predict(customersdata[['products_purchased','complains','money_spent']])
Note that we’re using the fit_predict method to train the model.
In the next section, we’re going to discuss how to visualize customer segmentation clusters in three dimensions.
In this section, we’ll be implementing some code using plotly express. This way we’ll visualize the clusters in three dimensions, formed by our k-means algorithm. Plotly express is a library based on plotly that works on several types of datasets and generates highly-styled plots.
First, let’s add a new column named ‘clusters’ to the existing customer data dataset. This column will be able to tell which customer belongs to what cluster.
# Create data arrays cluster_centers = kmeans_model_new.cluster_centers_ data = np.expm1(cluster_centers) points = np.append(data, cluster_centers, axis=1) points
Note that we’re using NumPy expm1 methods here. NumPy expm1 function returns the exponential value of minus one for each element given inside a NumPy array as output. Therefore, the np.expm1 method accepts arr_name and out arguments and then returns the array as outputs.
# Add "clusters" to customers data points = np.append(points, [[0], [1], [2], [3], [4]], axis=1) customersdata["clusters"] = kmeans_model_new.labels_
After adding the new column, named clusters, the customer data dataset will look as below.

Finally, we’re going to use the below code to visualize the five clusters created. This is done using plotly with the express library.
Plotly is a Python library used for graphing, statistics, plotting, and analytics. This can be used along with Python, R, Julia, and other programming languages. Plotly is a free and open-source library.
Want to organize your experimentation process? Check how you can have interactive Plotly charts stored in the same place as the rest of your model metadata (metrics, parameters, weights, and more).
Plotly Express is a high-level interface over Plotly, that works on several types of datasets and generates highly-styled plots.
The plotly.express class has functions that can produce entire figures in one go. Generally, it’s referred to as px. It’s worth noting plotly express is the built-in module of the plotly library. This is the starting point of creating the most common plots as recommended. Note that each plotly express function creates graph objects internally and returns plotly.graph_objects.
A graph created by a single method call using plotly express can be also created using graph objects only. However, in that case, it takes around 5 to 100 times as much code.
As the 2D scatter plot, px.scatter plots individual data in a two-dimensional space, and the 3D method px.scatter_3d plots individual data in a three-dimensional space.
# visualize clusters figure = px.scatter_3d(customersdata, color='clusters', x="products_purchased", y="complains", z="money_spent", category_orders = "clusters": ["0", "1", "2", "3", "4"]> ) figure.update_layout() figure.show()


Visualization of clusters of data points is very important. Various edges of the graph provide a quick view of the complex input data set.
It’s not wise to serve all customers with the same product model, email, text message campaign, or ad. Customers have different needs. A one-size-for-all approach to business will generally result in less engagement, lower-click through rates, and ultimately fewer sales. Customer segmentation is the cure for this problem.
Finding an optimal number of unique customer groups will help you understand how your customers differ, and help you give them exactly what they want. Customer segmentation improves customer experience and boosts company revenue. That’s why segmentation is a must if you want to surpass your competitors and get more customers. Doing it with machine learning is definitely the right way to go.
If you made it this far, thanks for reading!